
Core features and differentiators
Multi-source connectors, multi-site aggregation, business metrics alignment and clear visualizations.
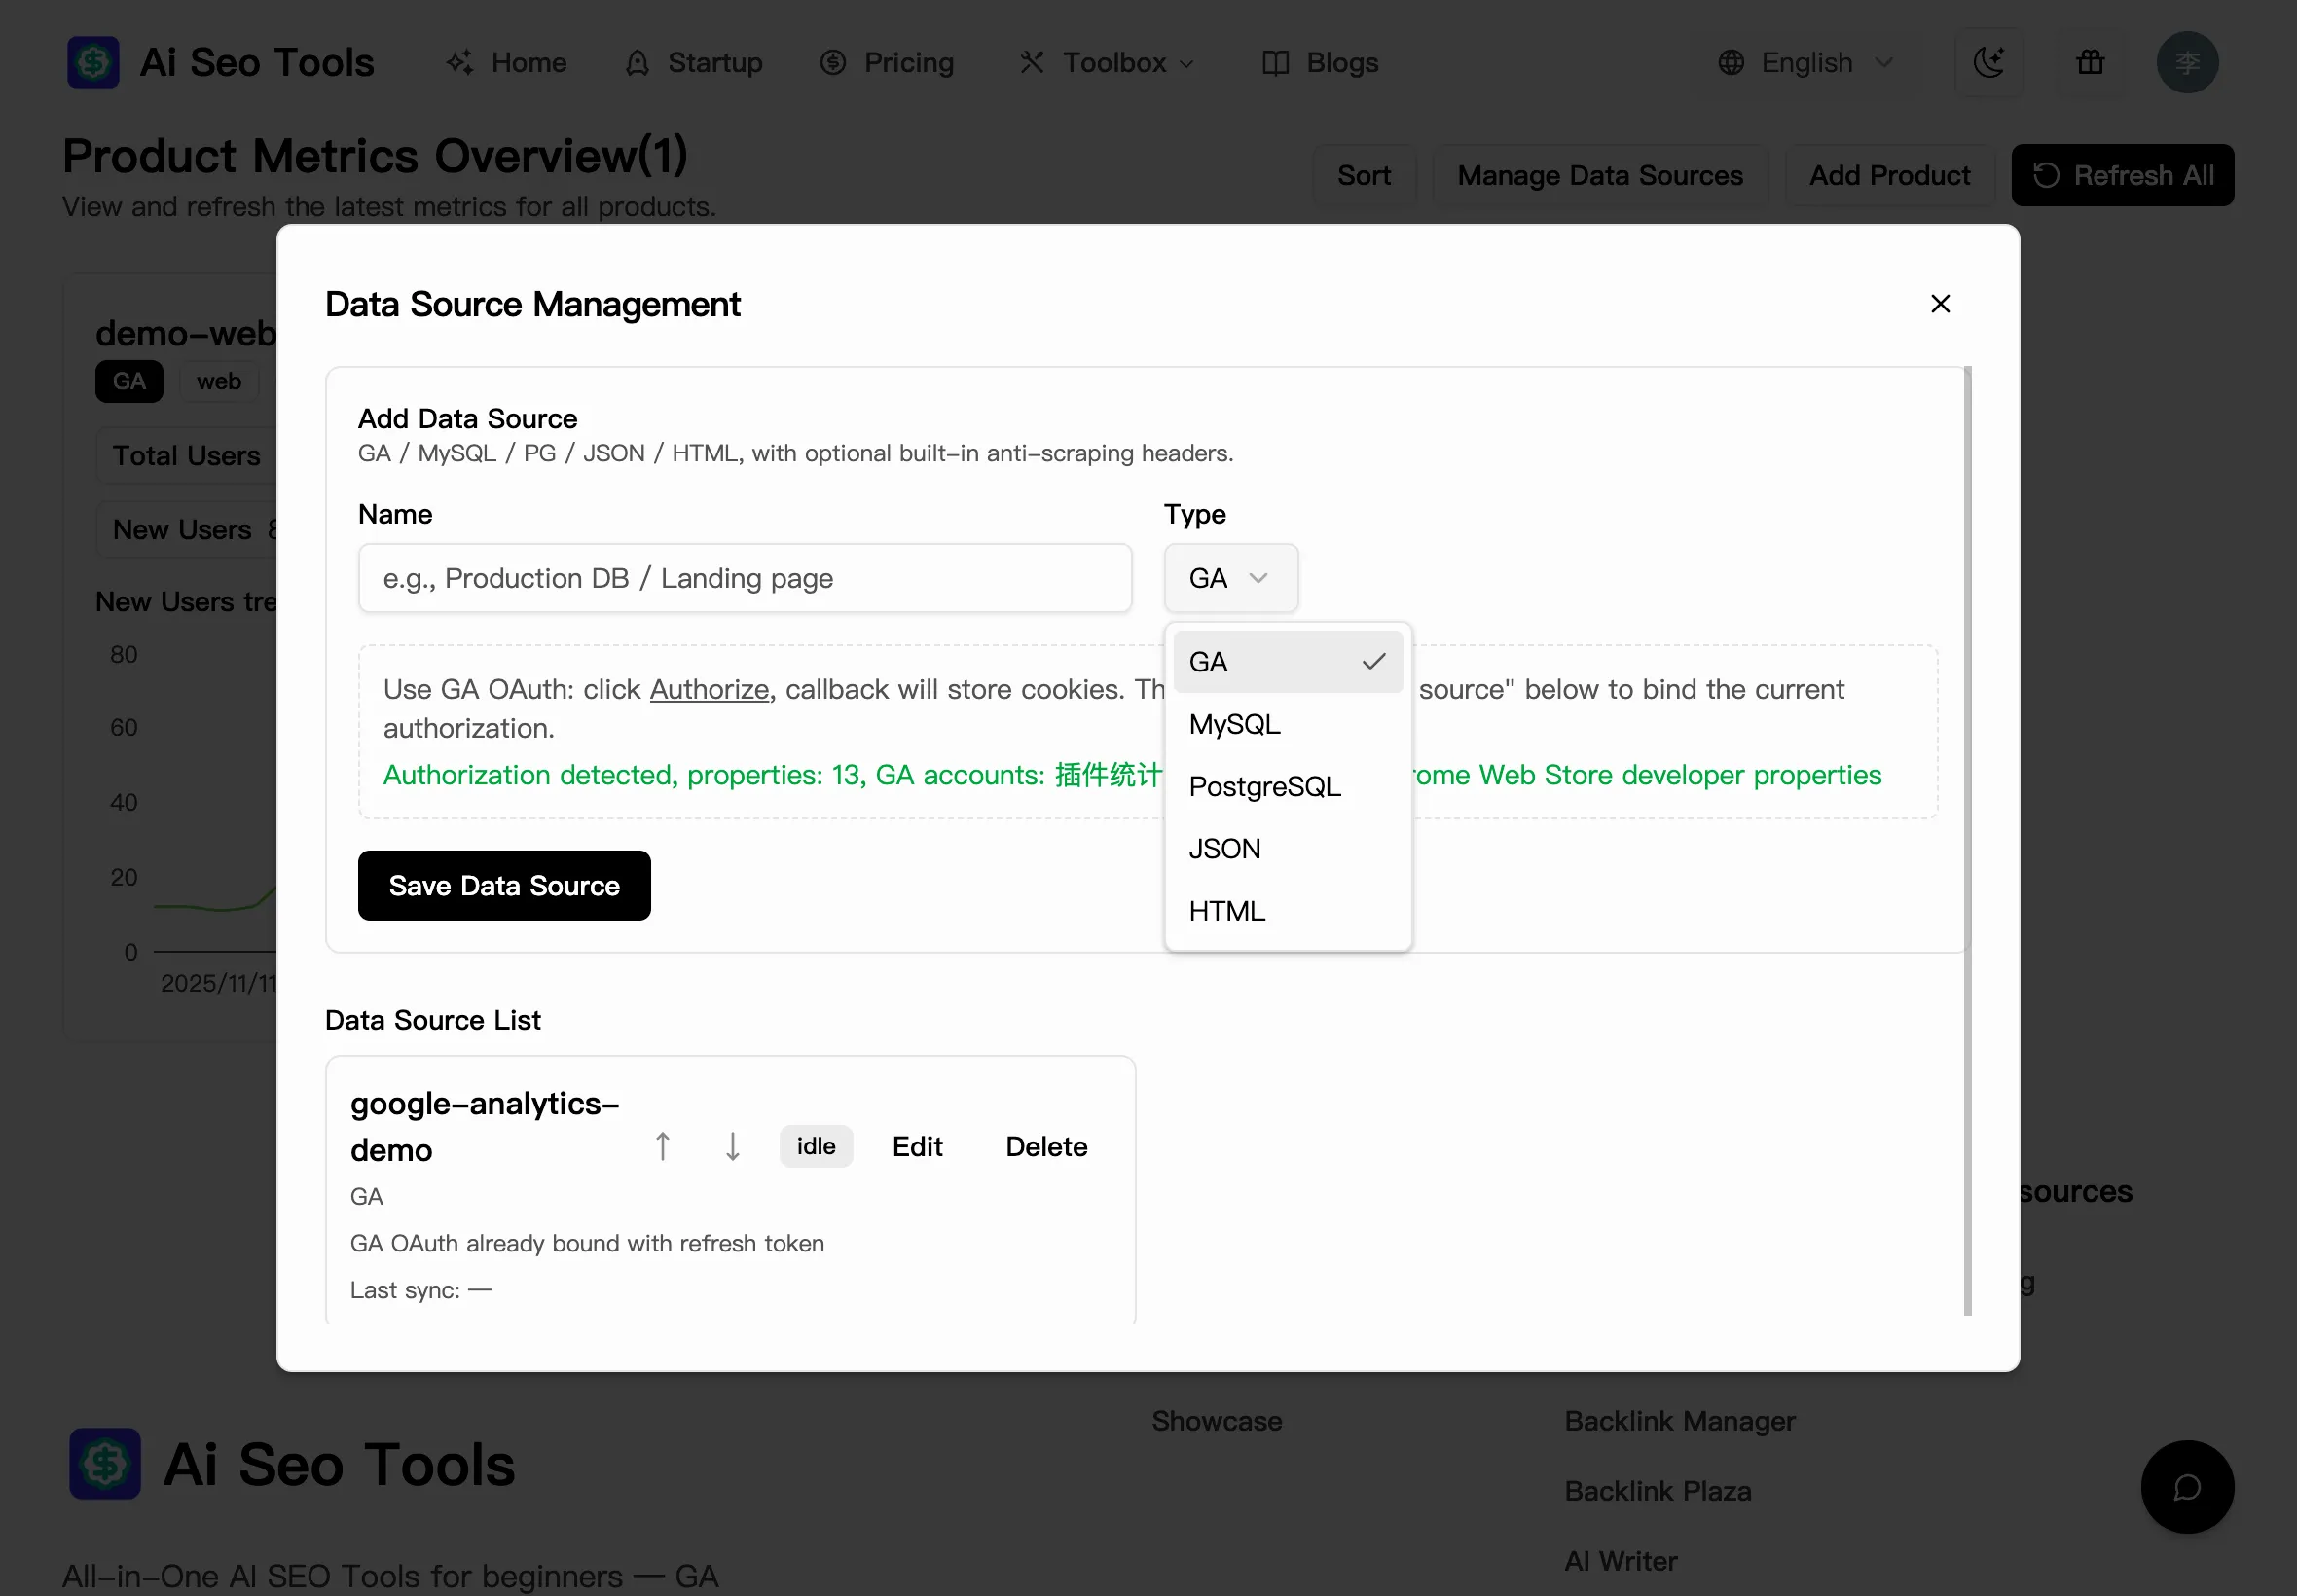
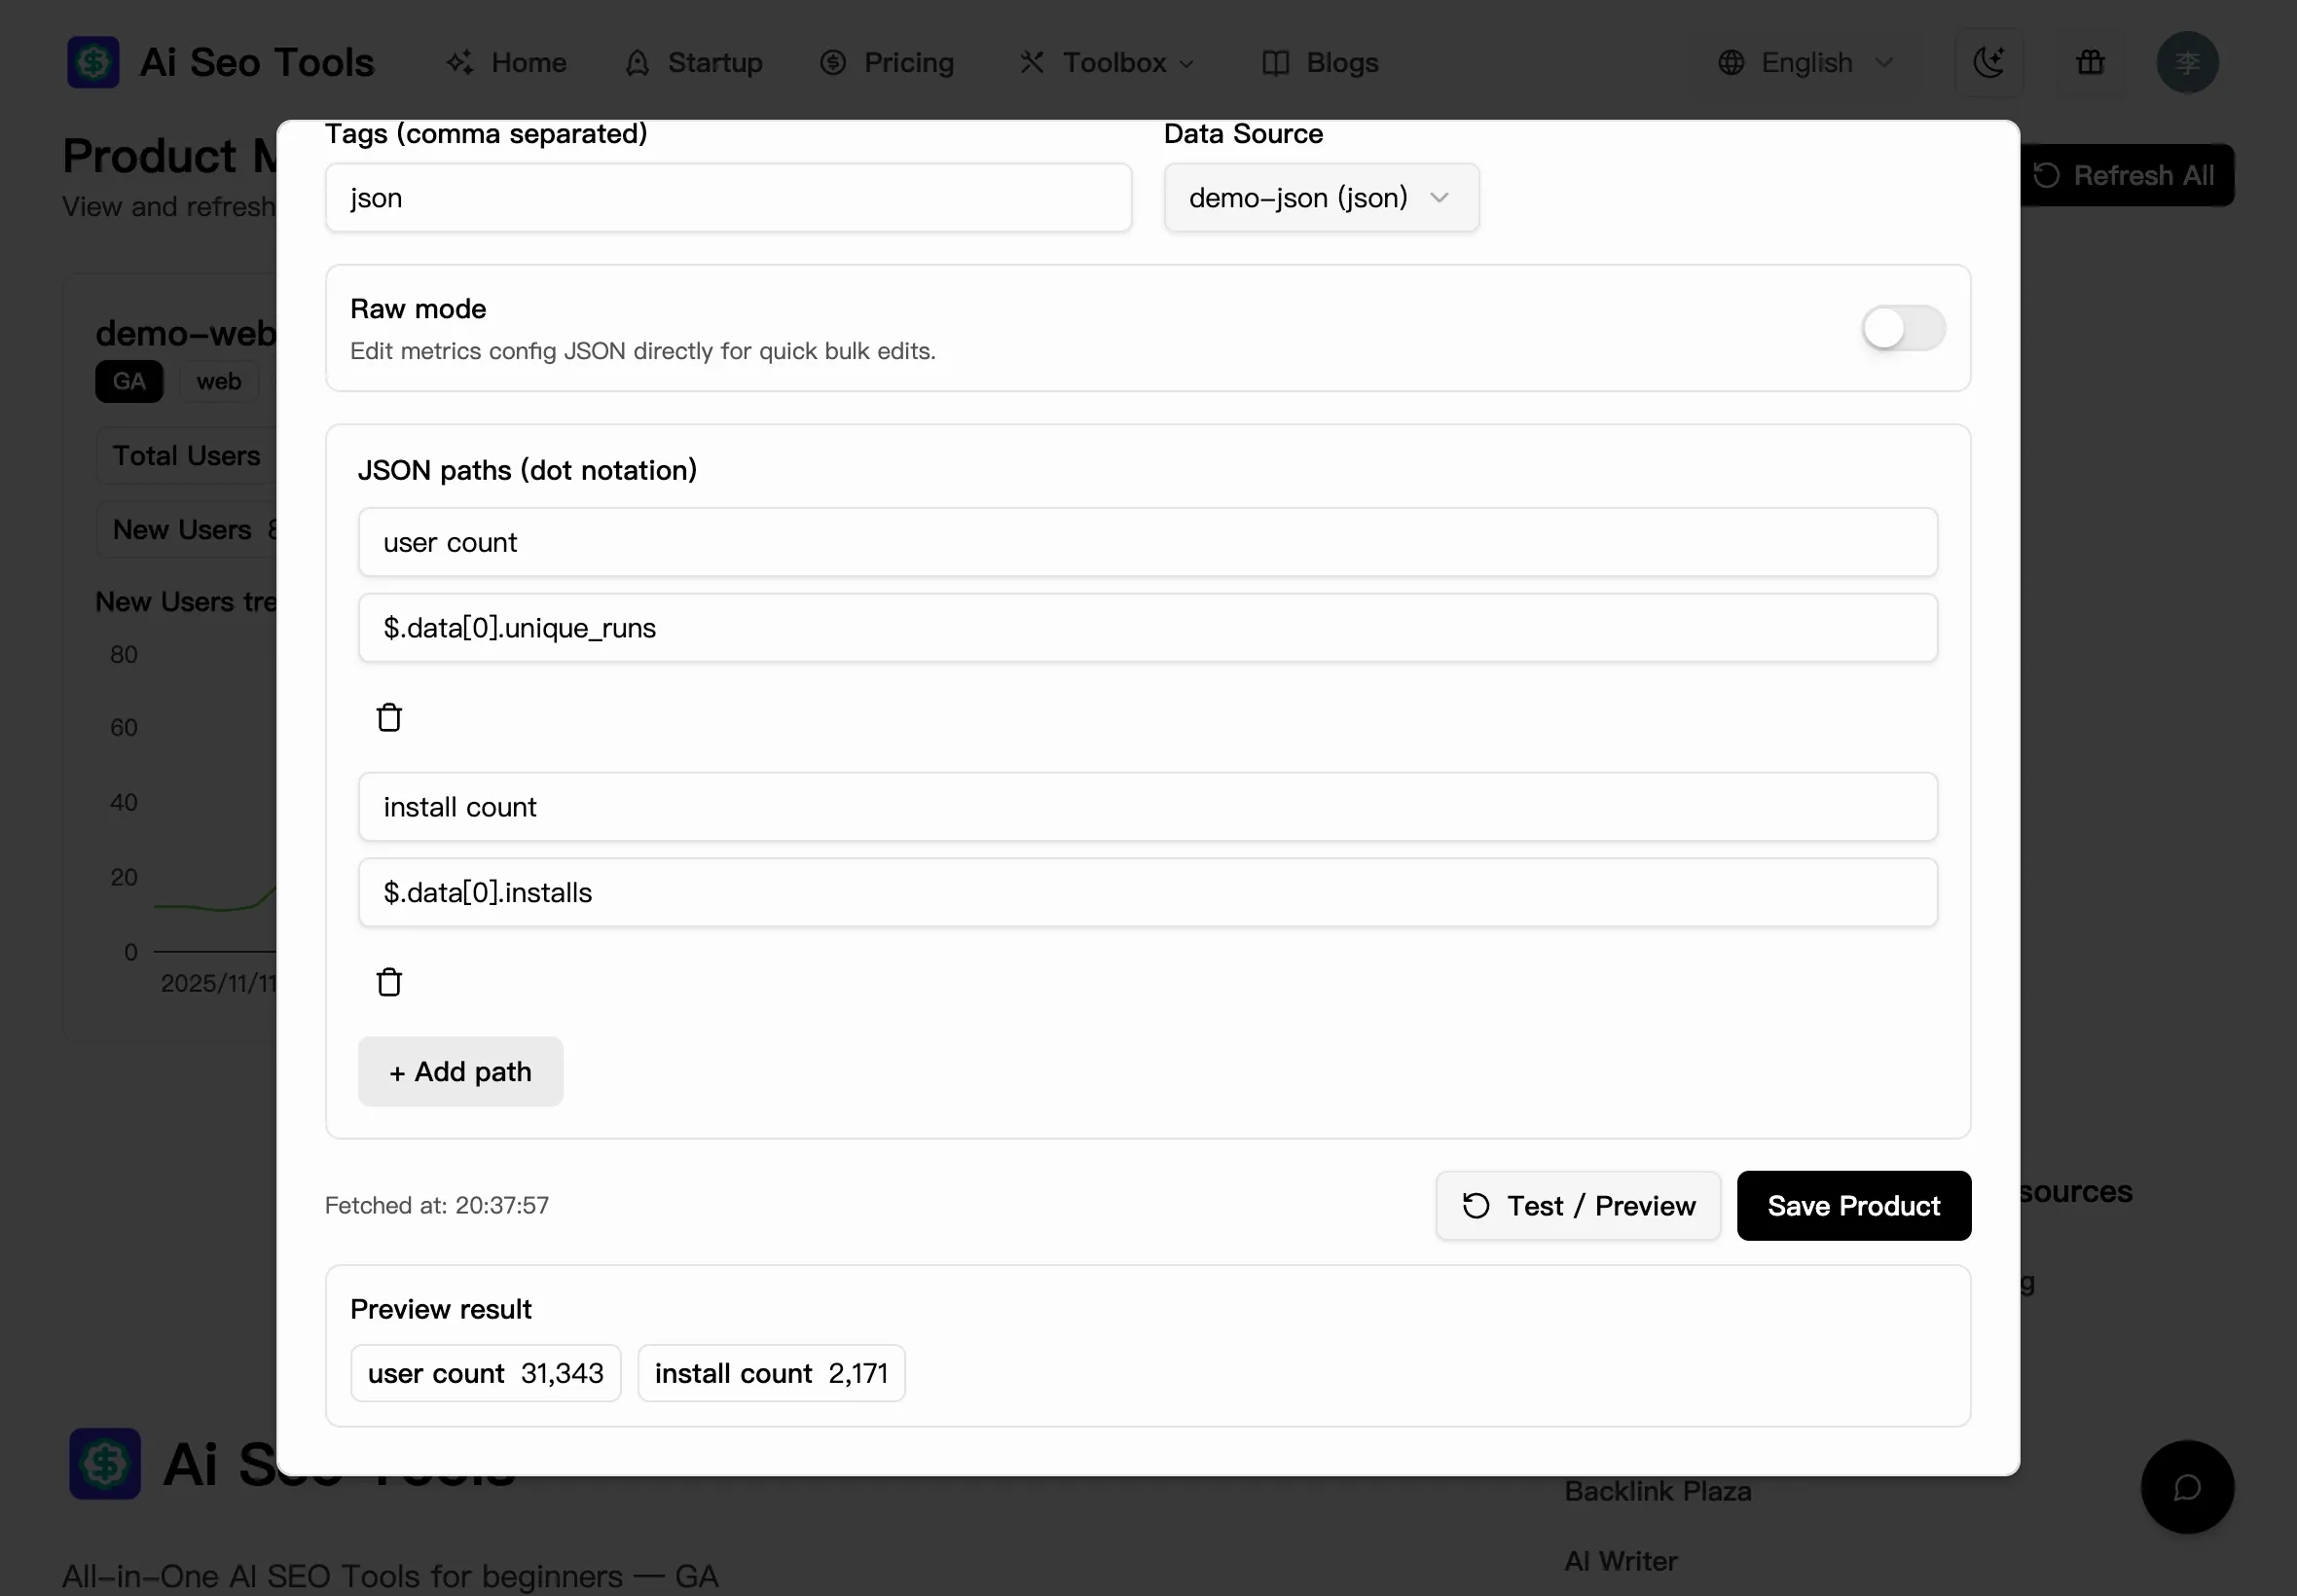
Multi-source connectors
Native GA OAuth plus MySQL, PostgreSQL, JSON and HTML extraction in minutes.
Full funnel metrics
PV, UV, active, signups, orders, retention—all in one place.
Multi-site / product aggregation
View different sites or product lines together without tab hopping.
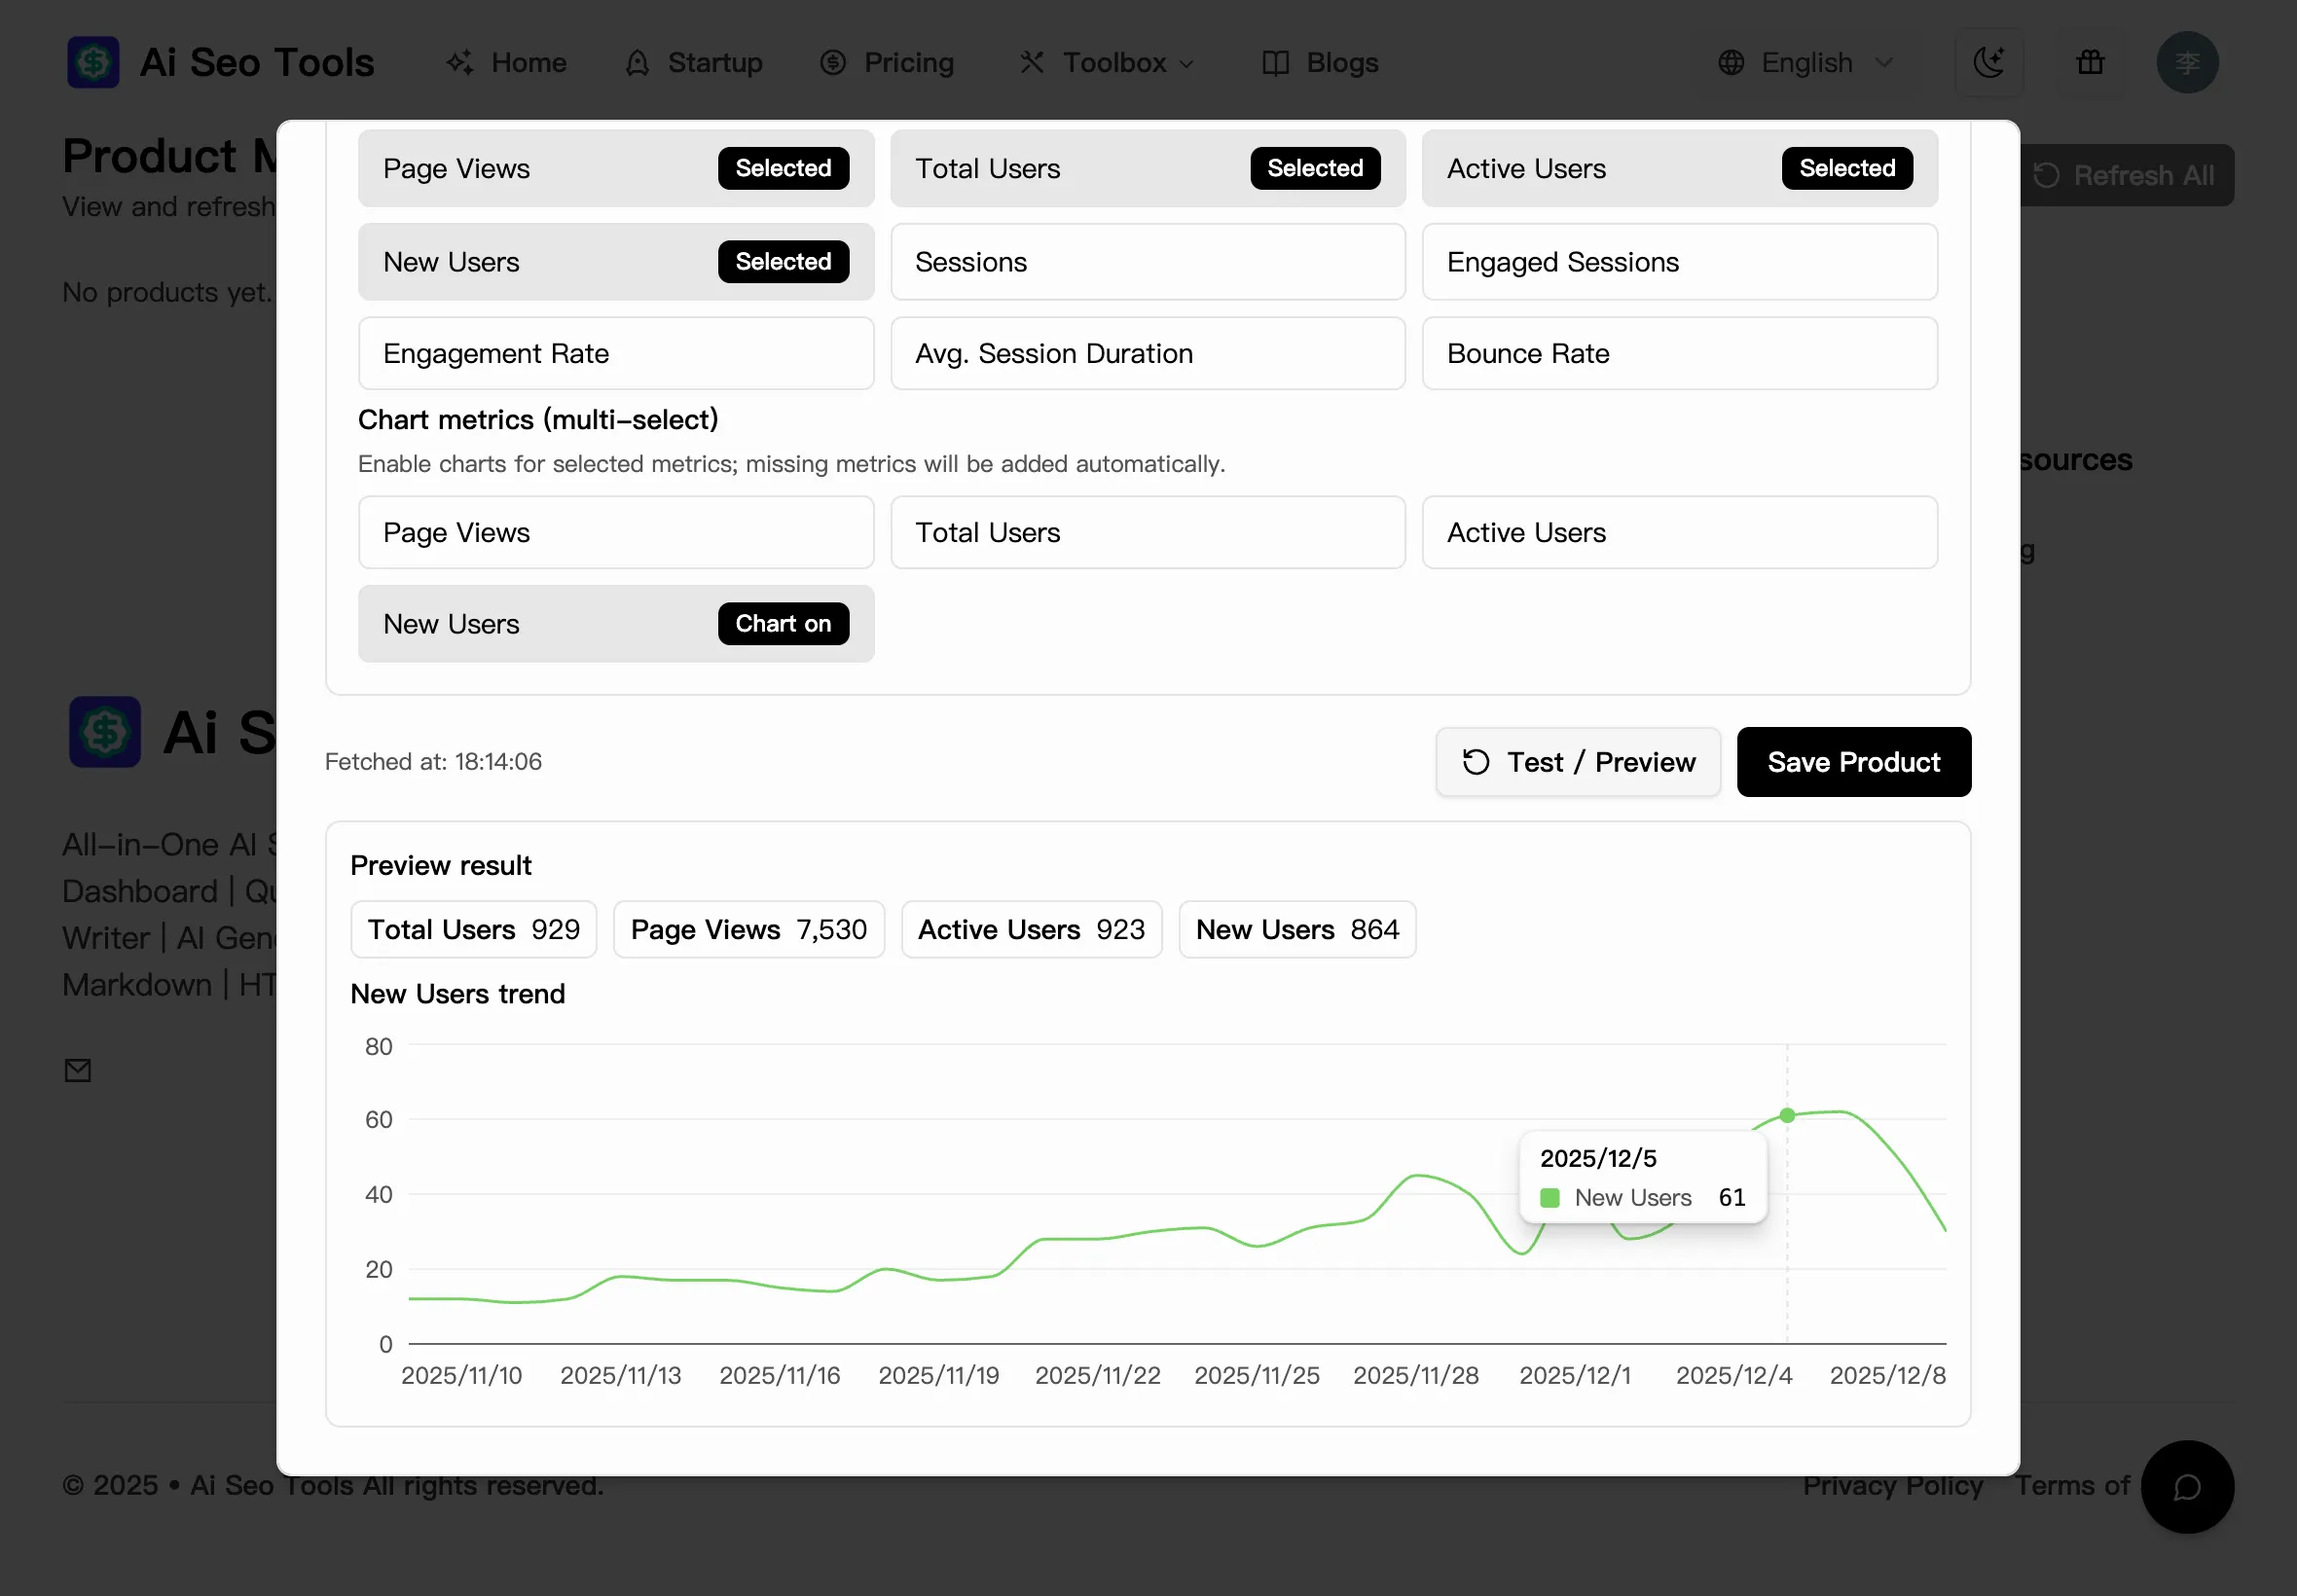
Visual comparisons
Lines, bars and KPI grids for instant trend checks.
Real-time refresh
Auto-syncs the latest data to avoid blind spots.
Smart alerts (optional)
Instantly flag anomalies or conversion drops.
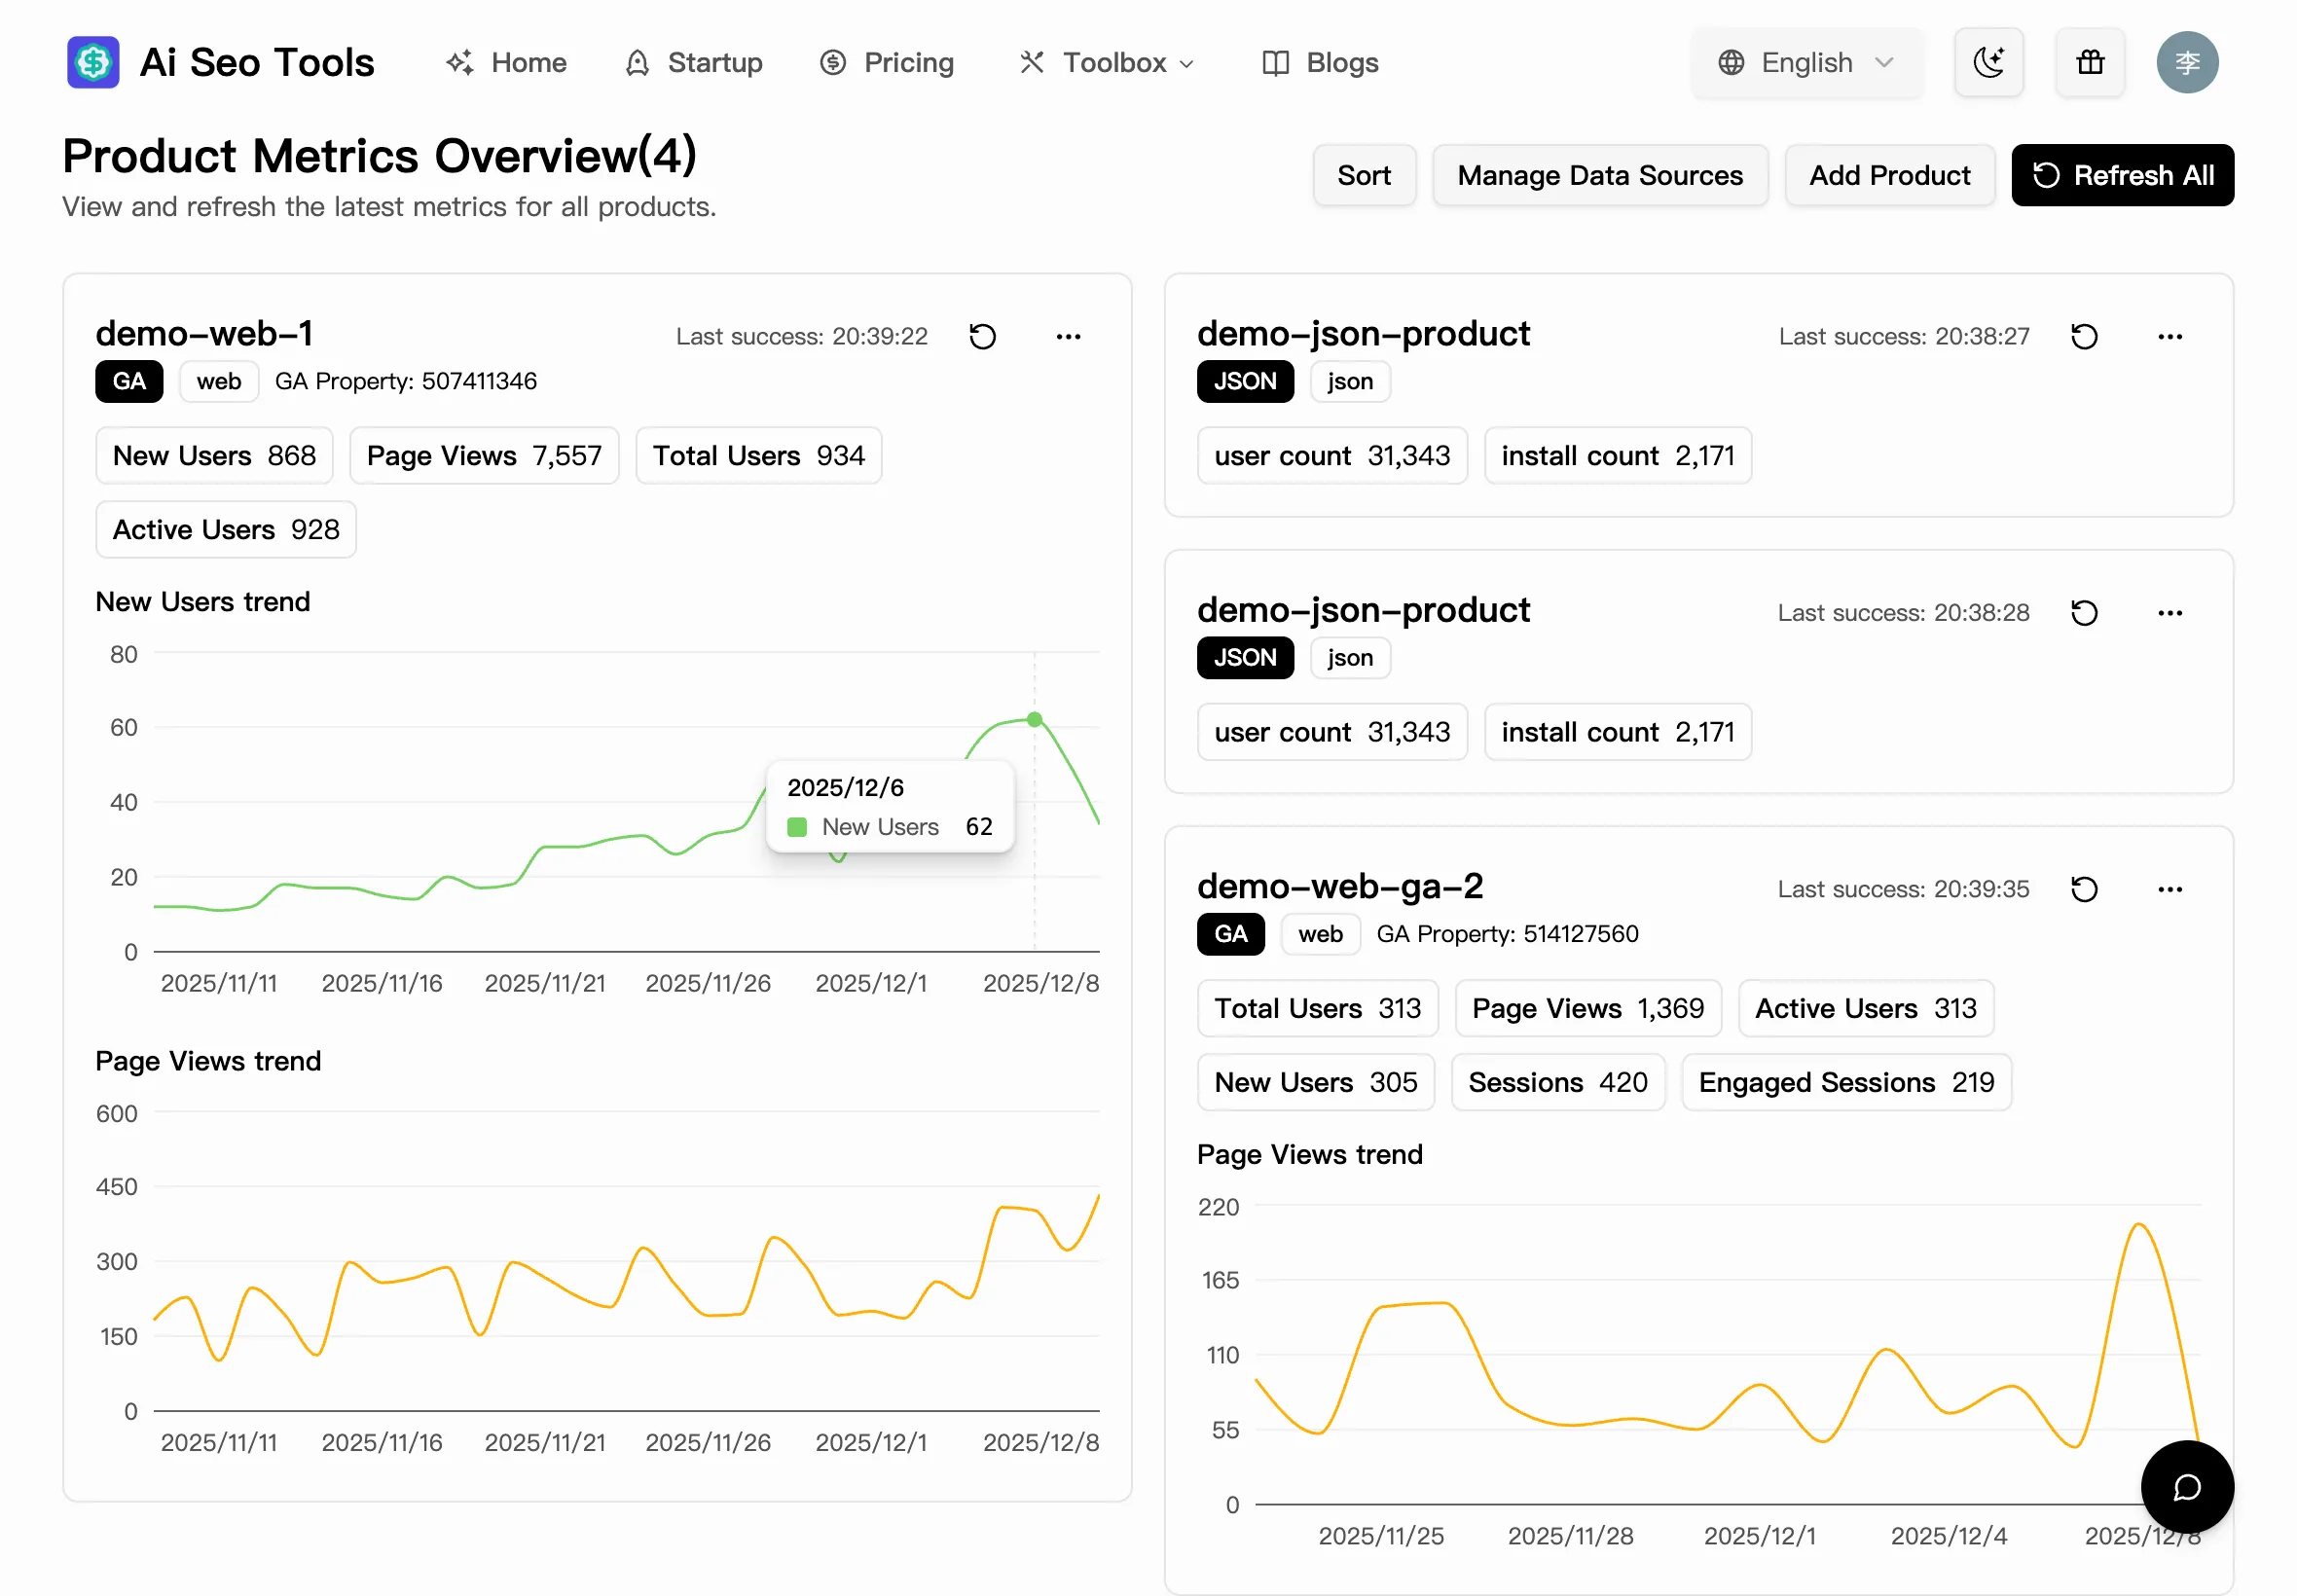
Full-spectrum metrics for a complete and truthful picture
Nine-grid overview and trend charts so traffic and product KPIs stay aligned in one view.
Page Views (PV)
Total page hits
Unique Visitors (UV)
Distinct visitors
Active Users
Users with actions in a period
New Users
First-time visitors or signups
Sessions
Total visits
Engaged Sessions
>10s or conversion sessions
Engagement Rate
Engaged / Total sessions
Avg. Session Duration
Average time on site (sec)
Bounce Rate
Single-page sessions ratio

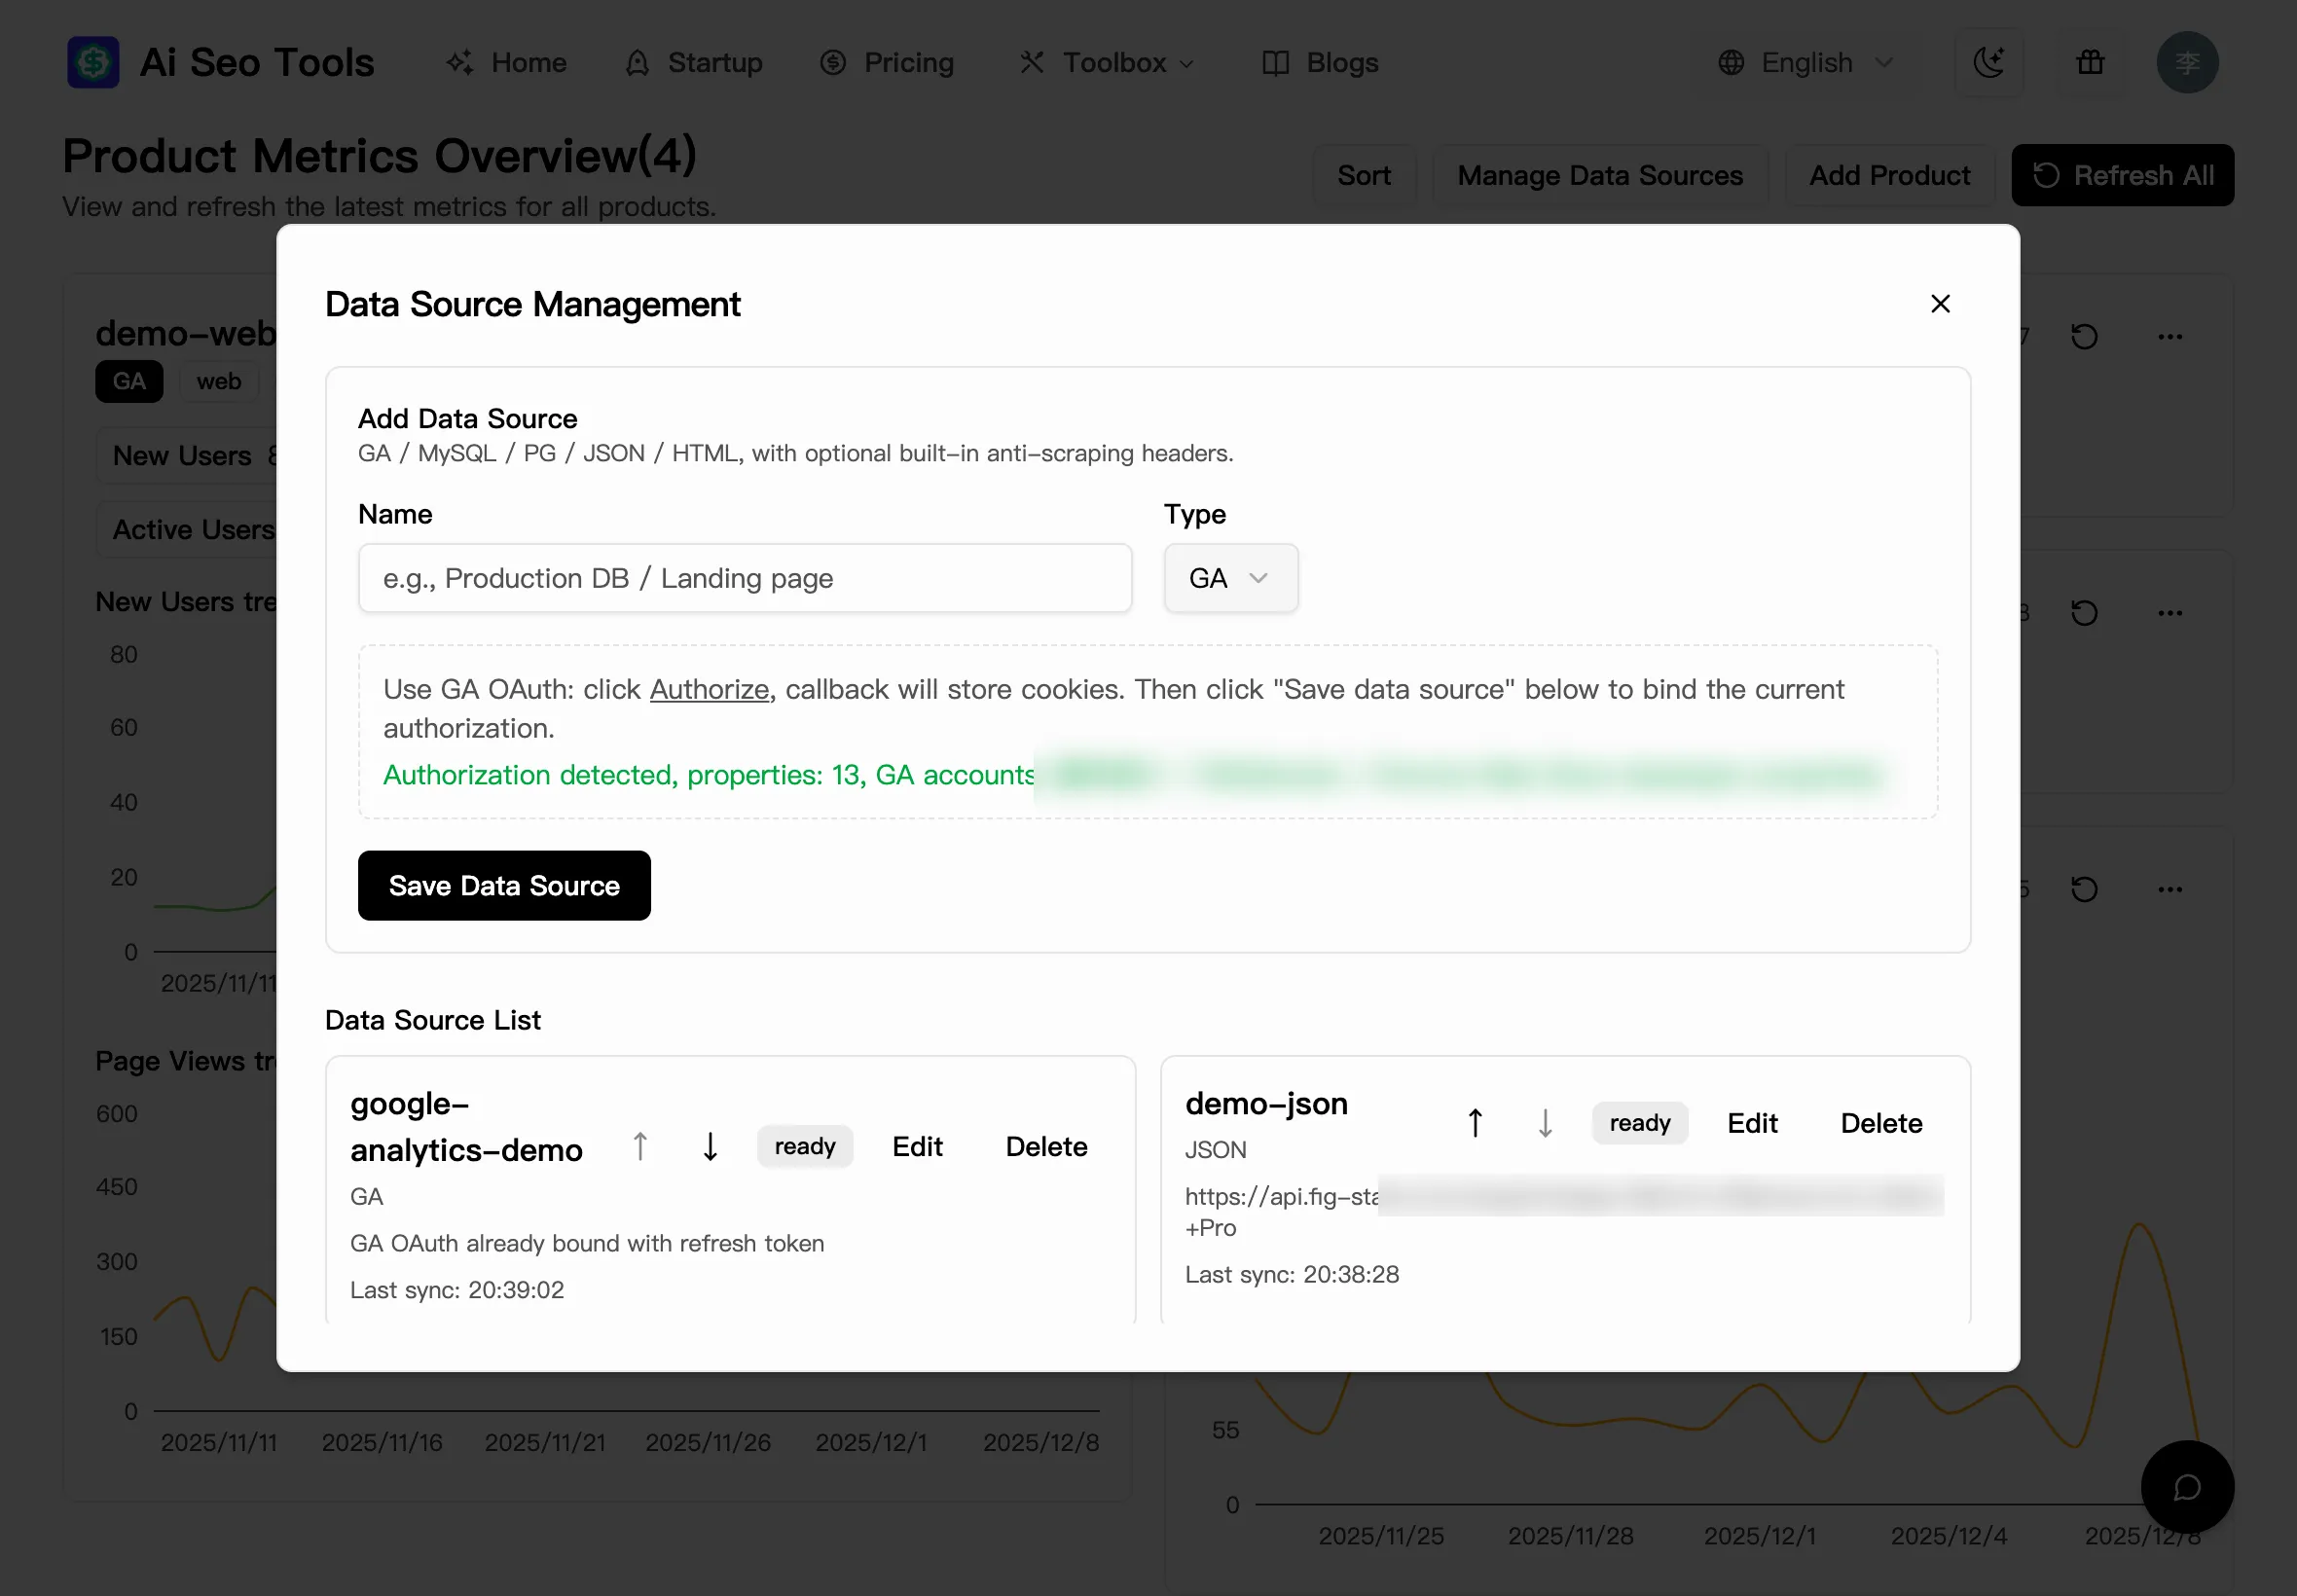
Beyond GA—align every product data source here
Auto-sync GA plus database / JSON / HTML data to cover traffic → users → conversions → retention in one screen.
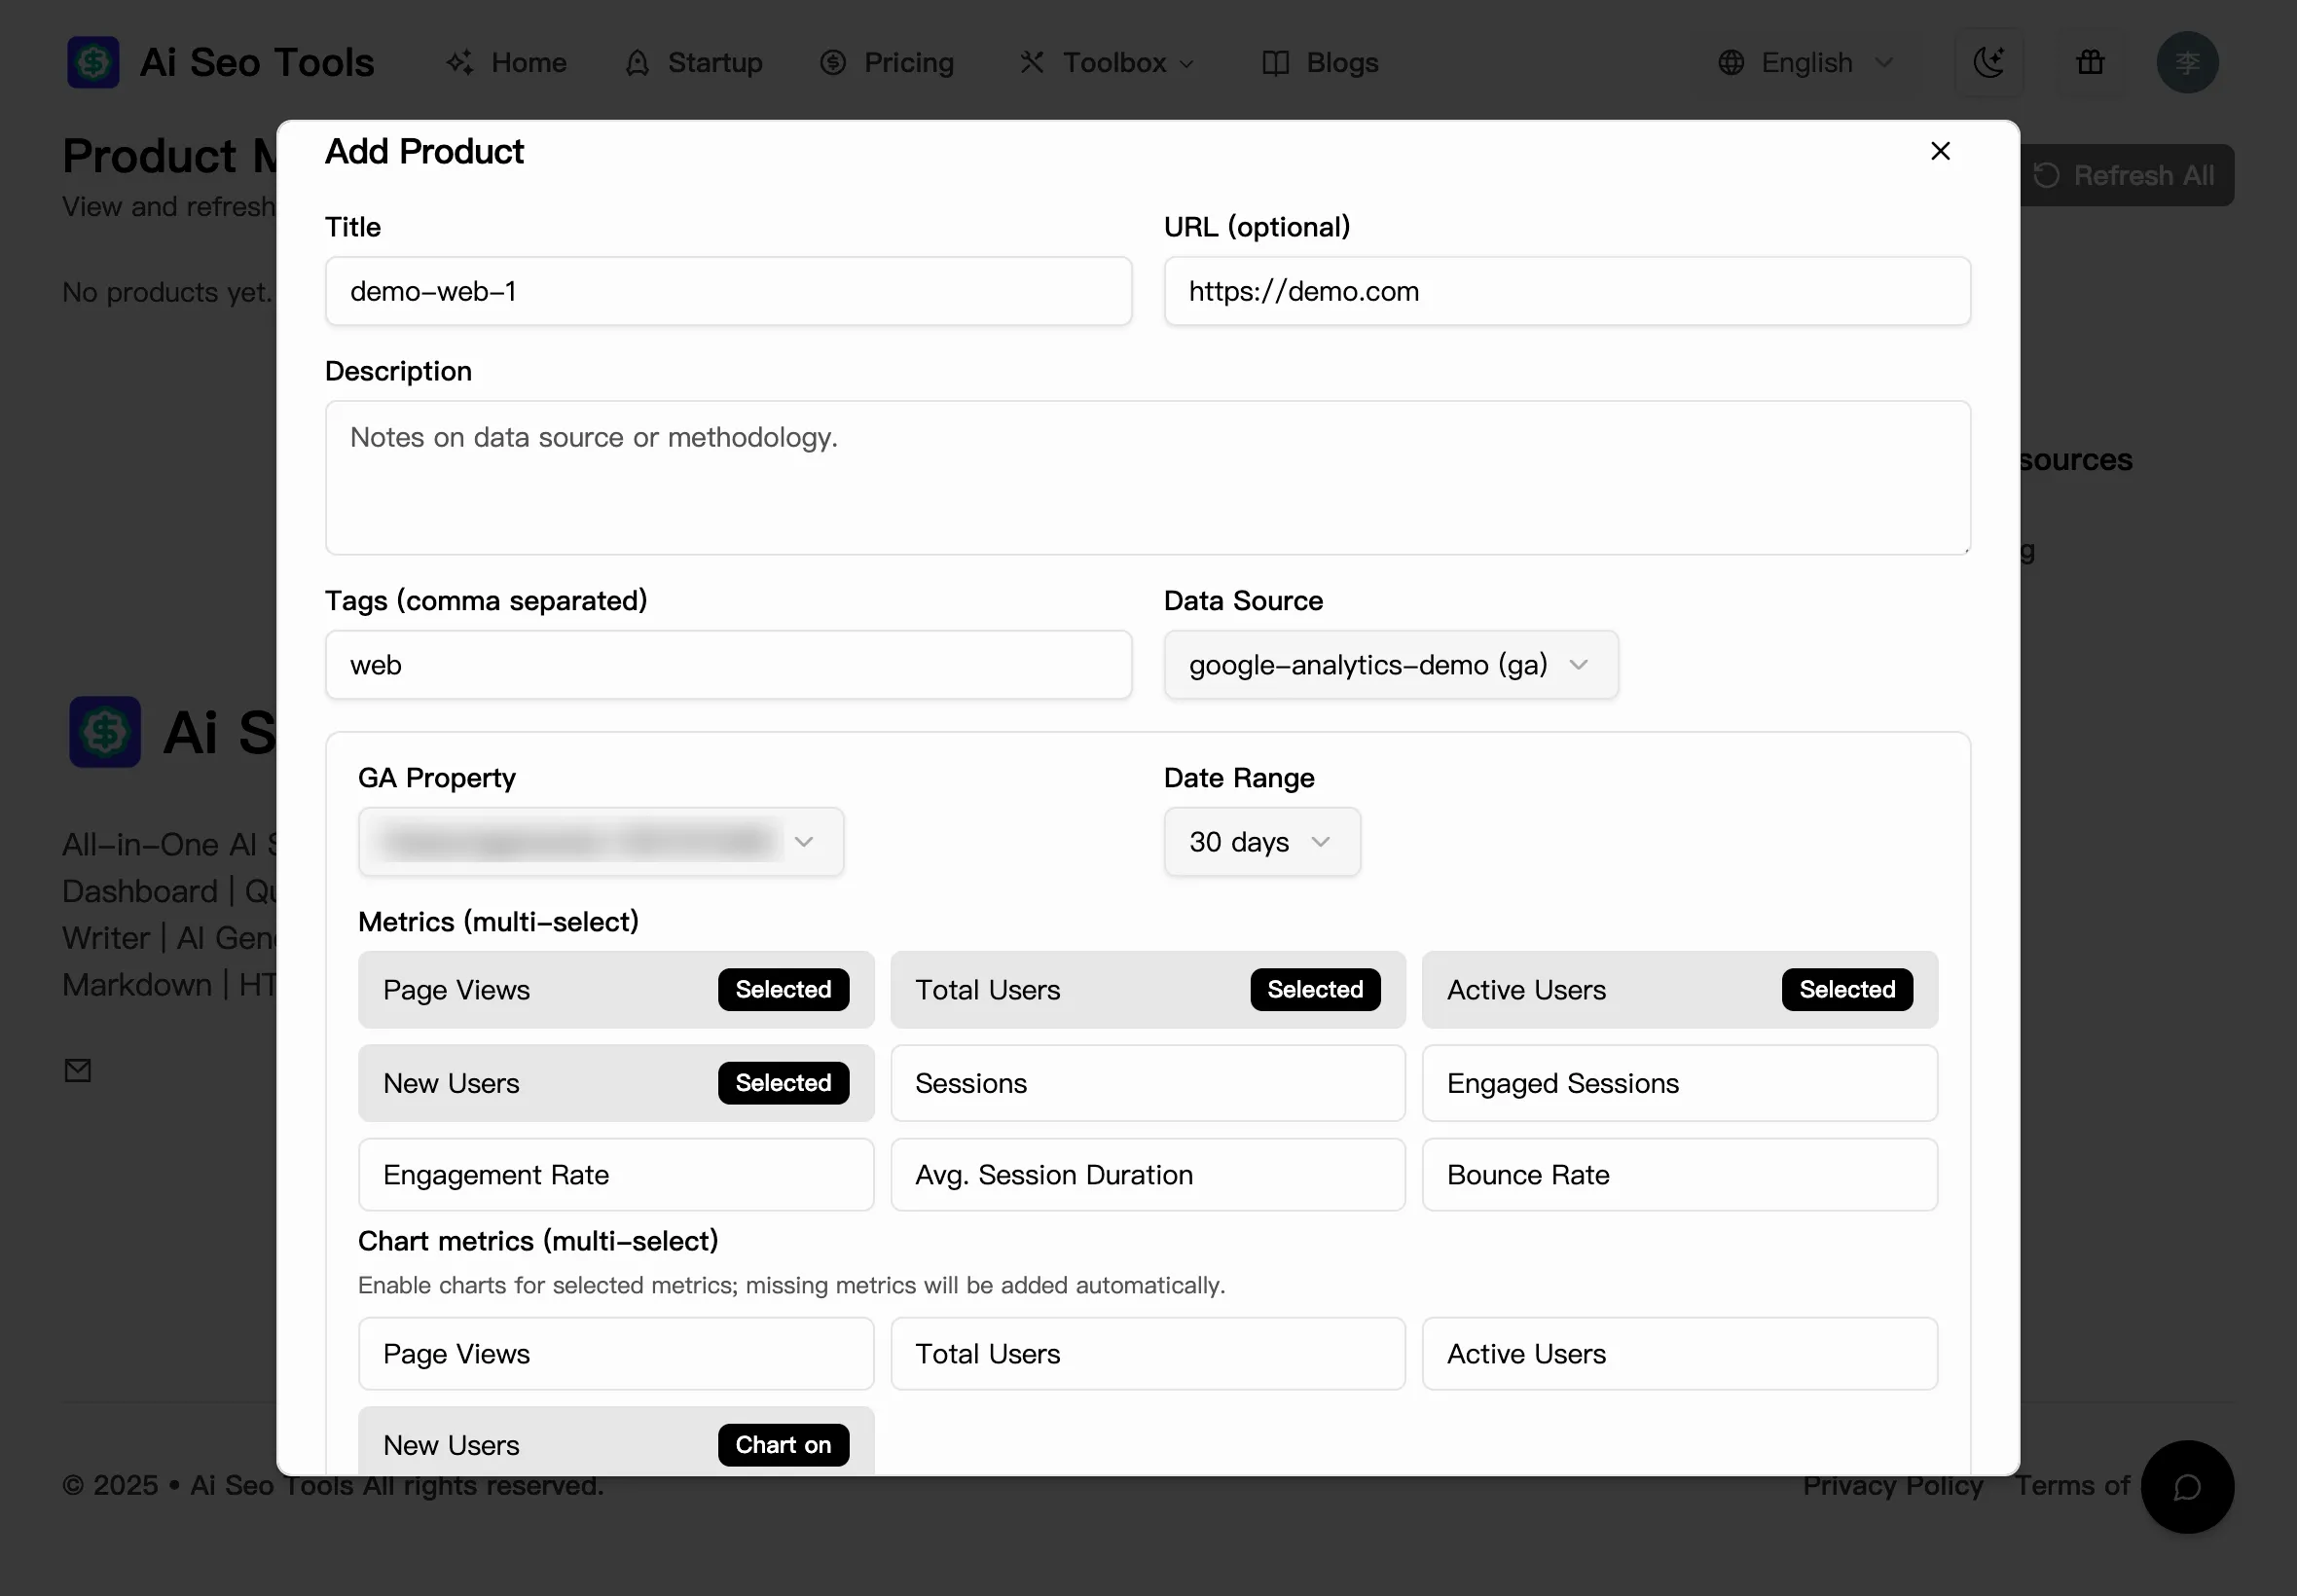
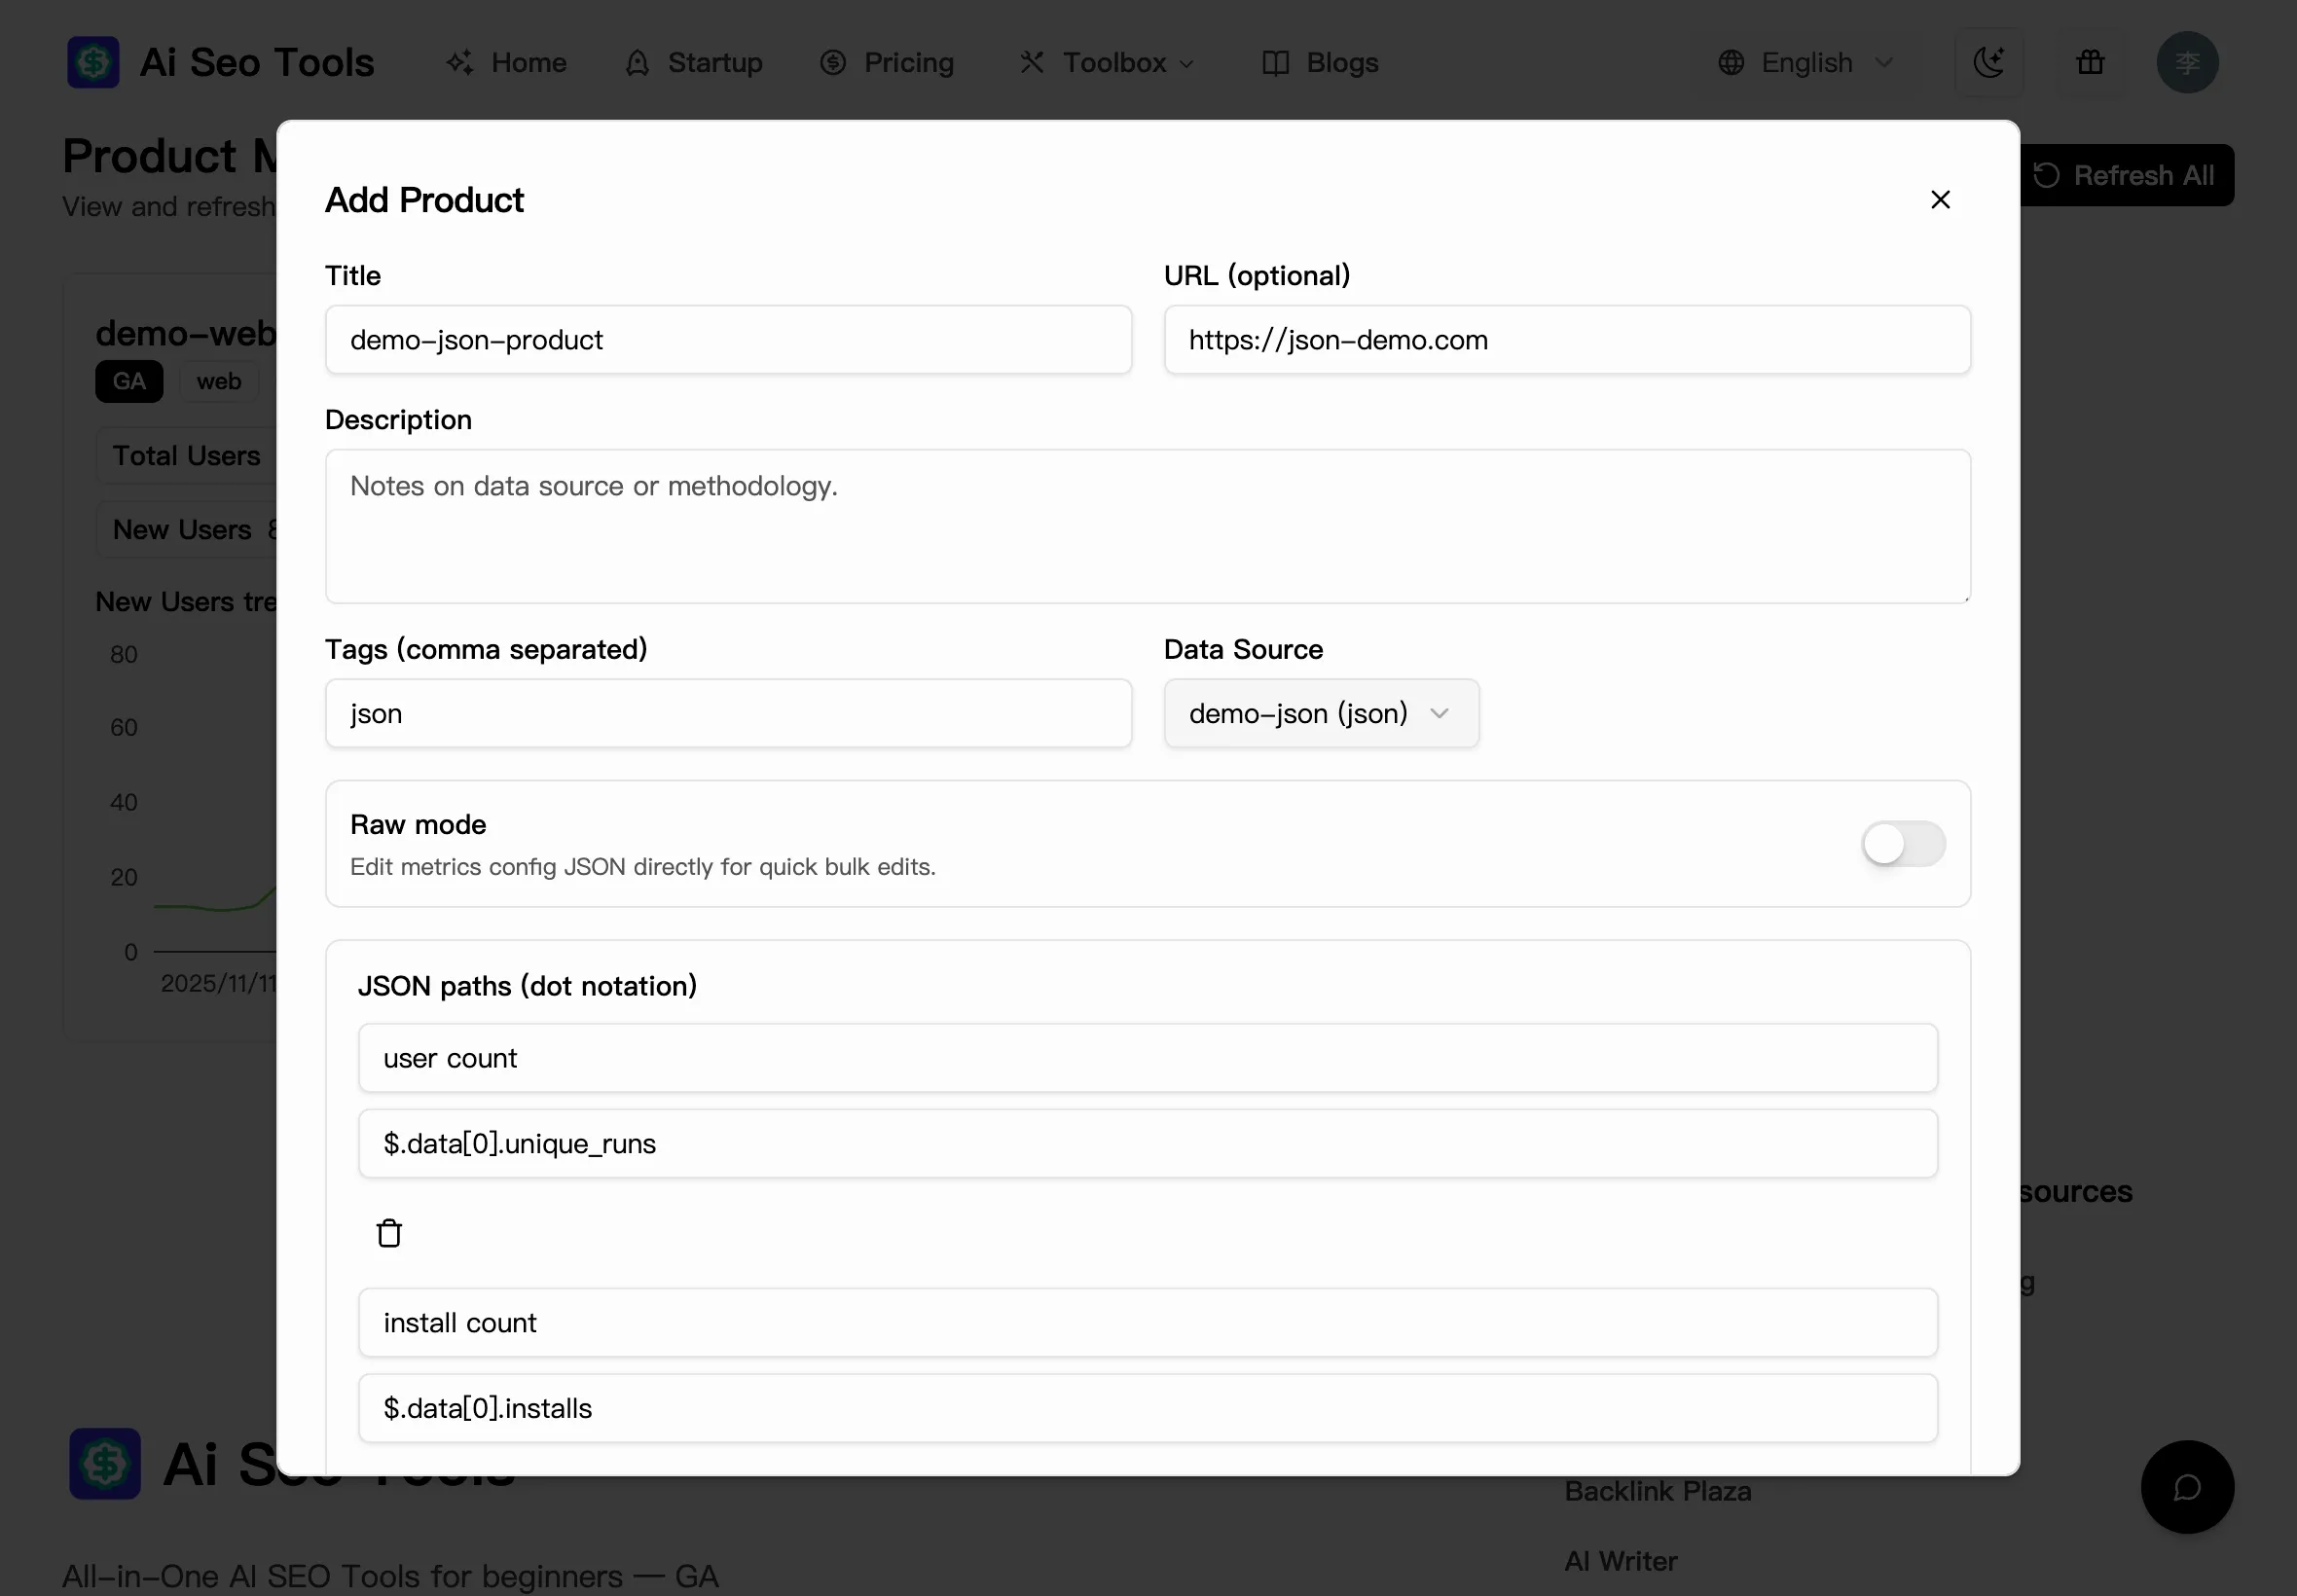
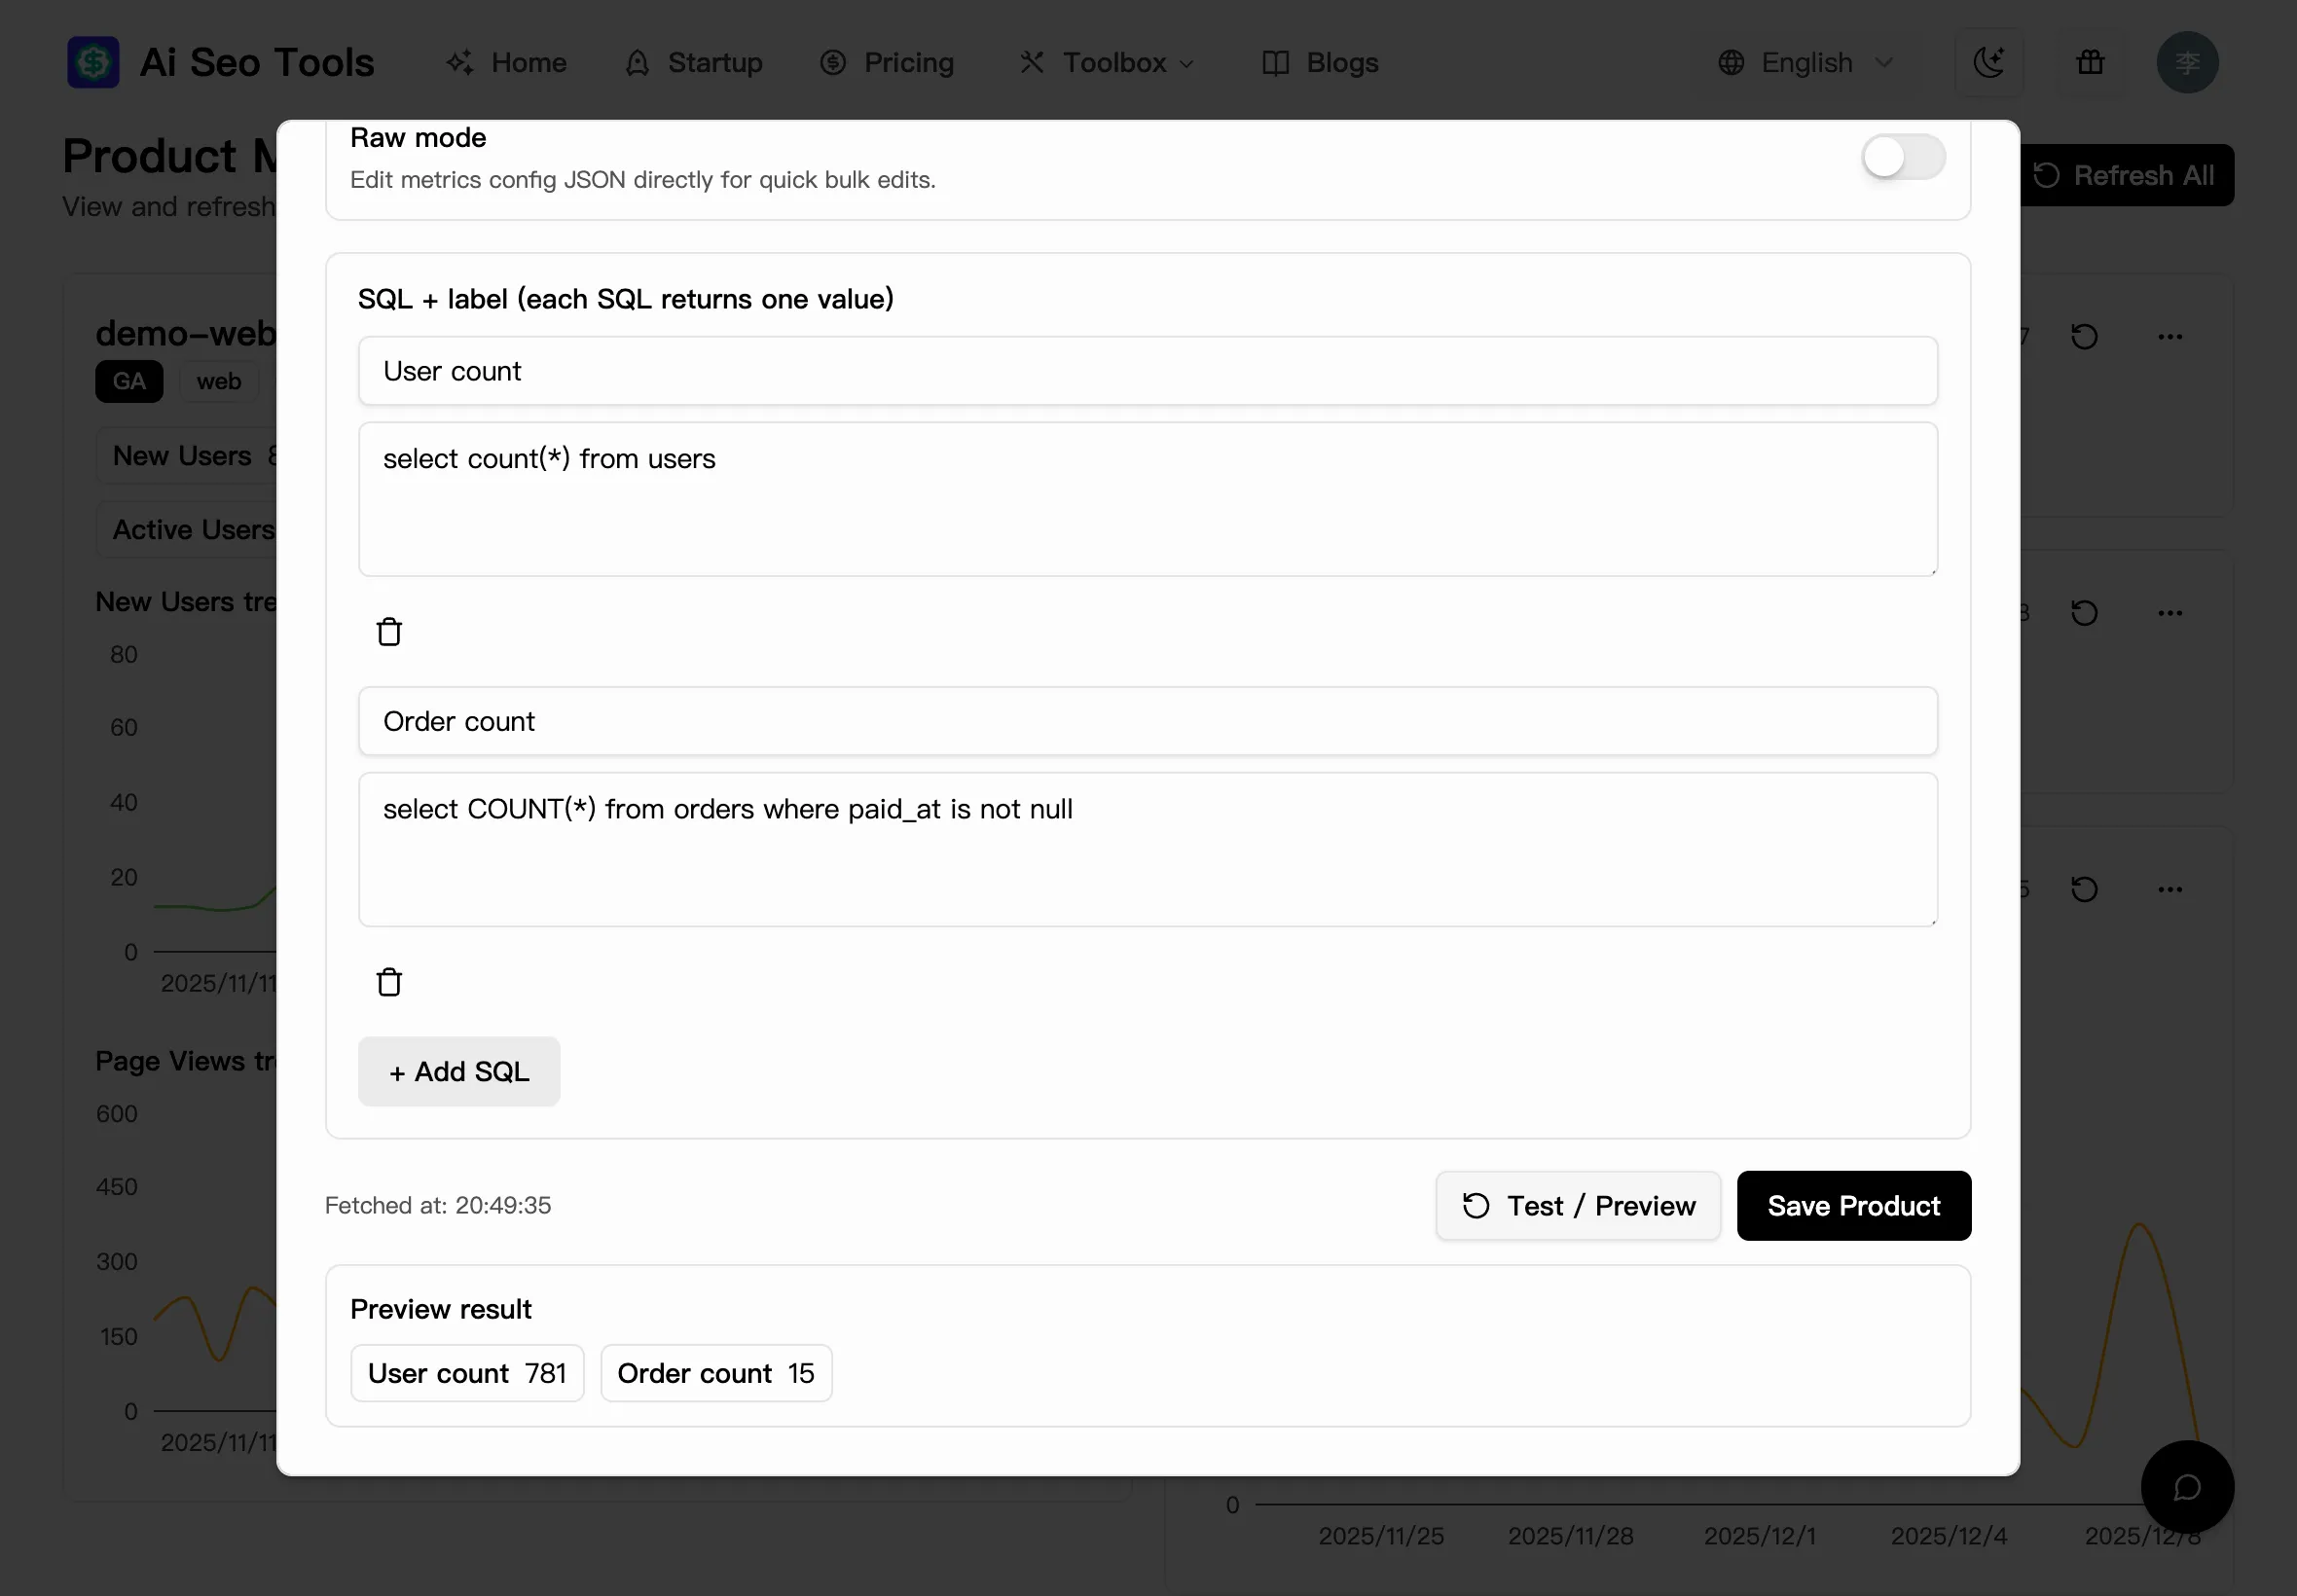
- Multi-source ingestionGA OAuth plus DB connections and JSON/HTML field mapping built in.
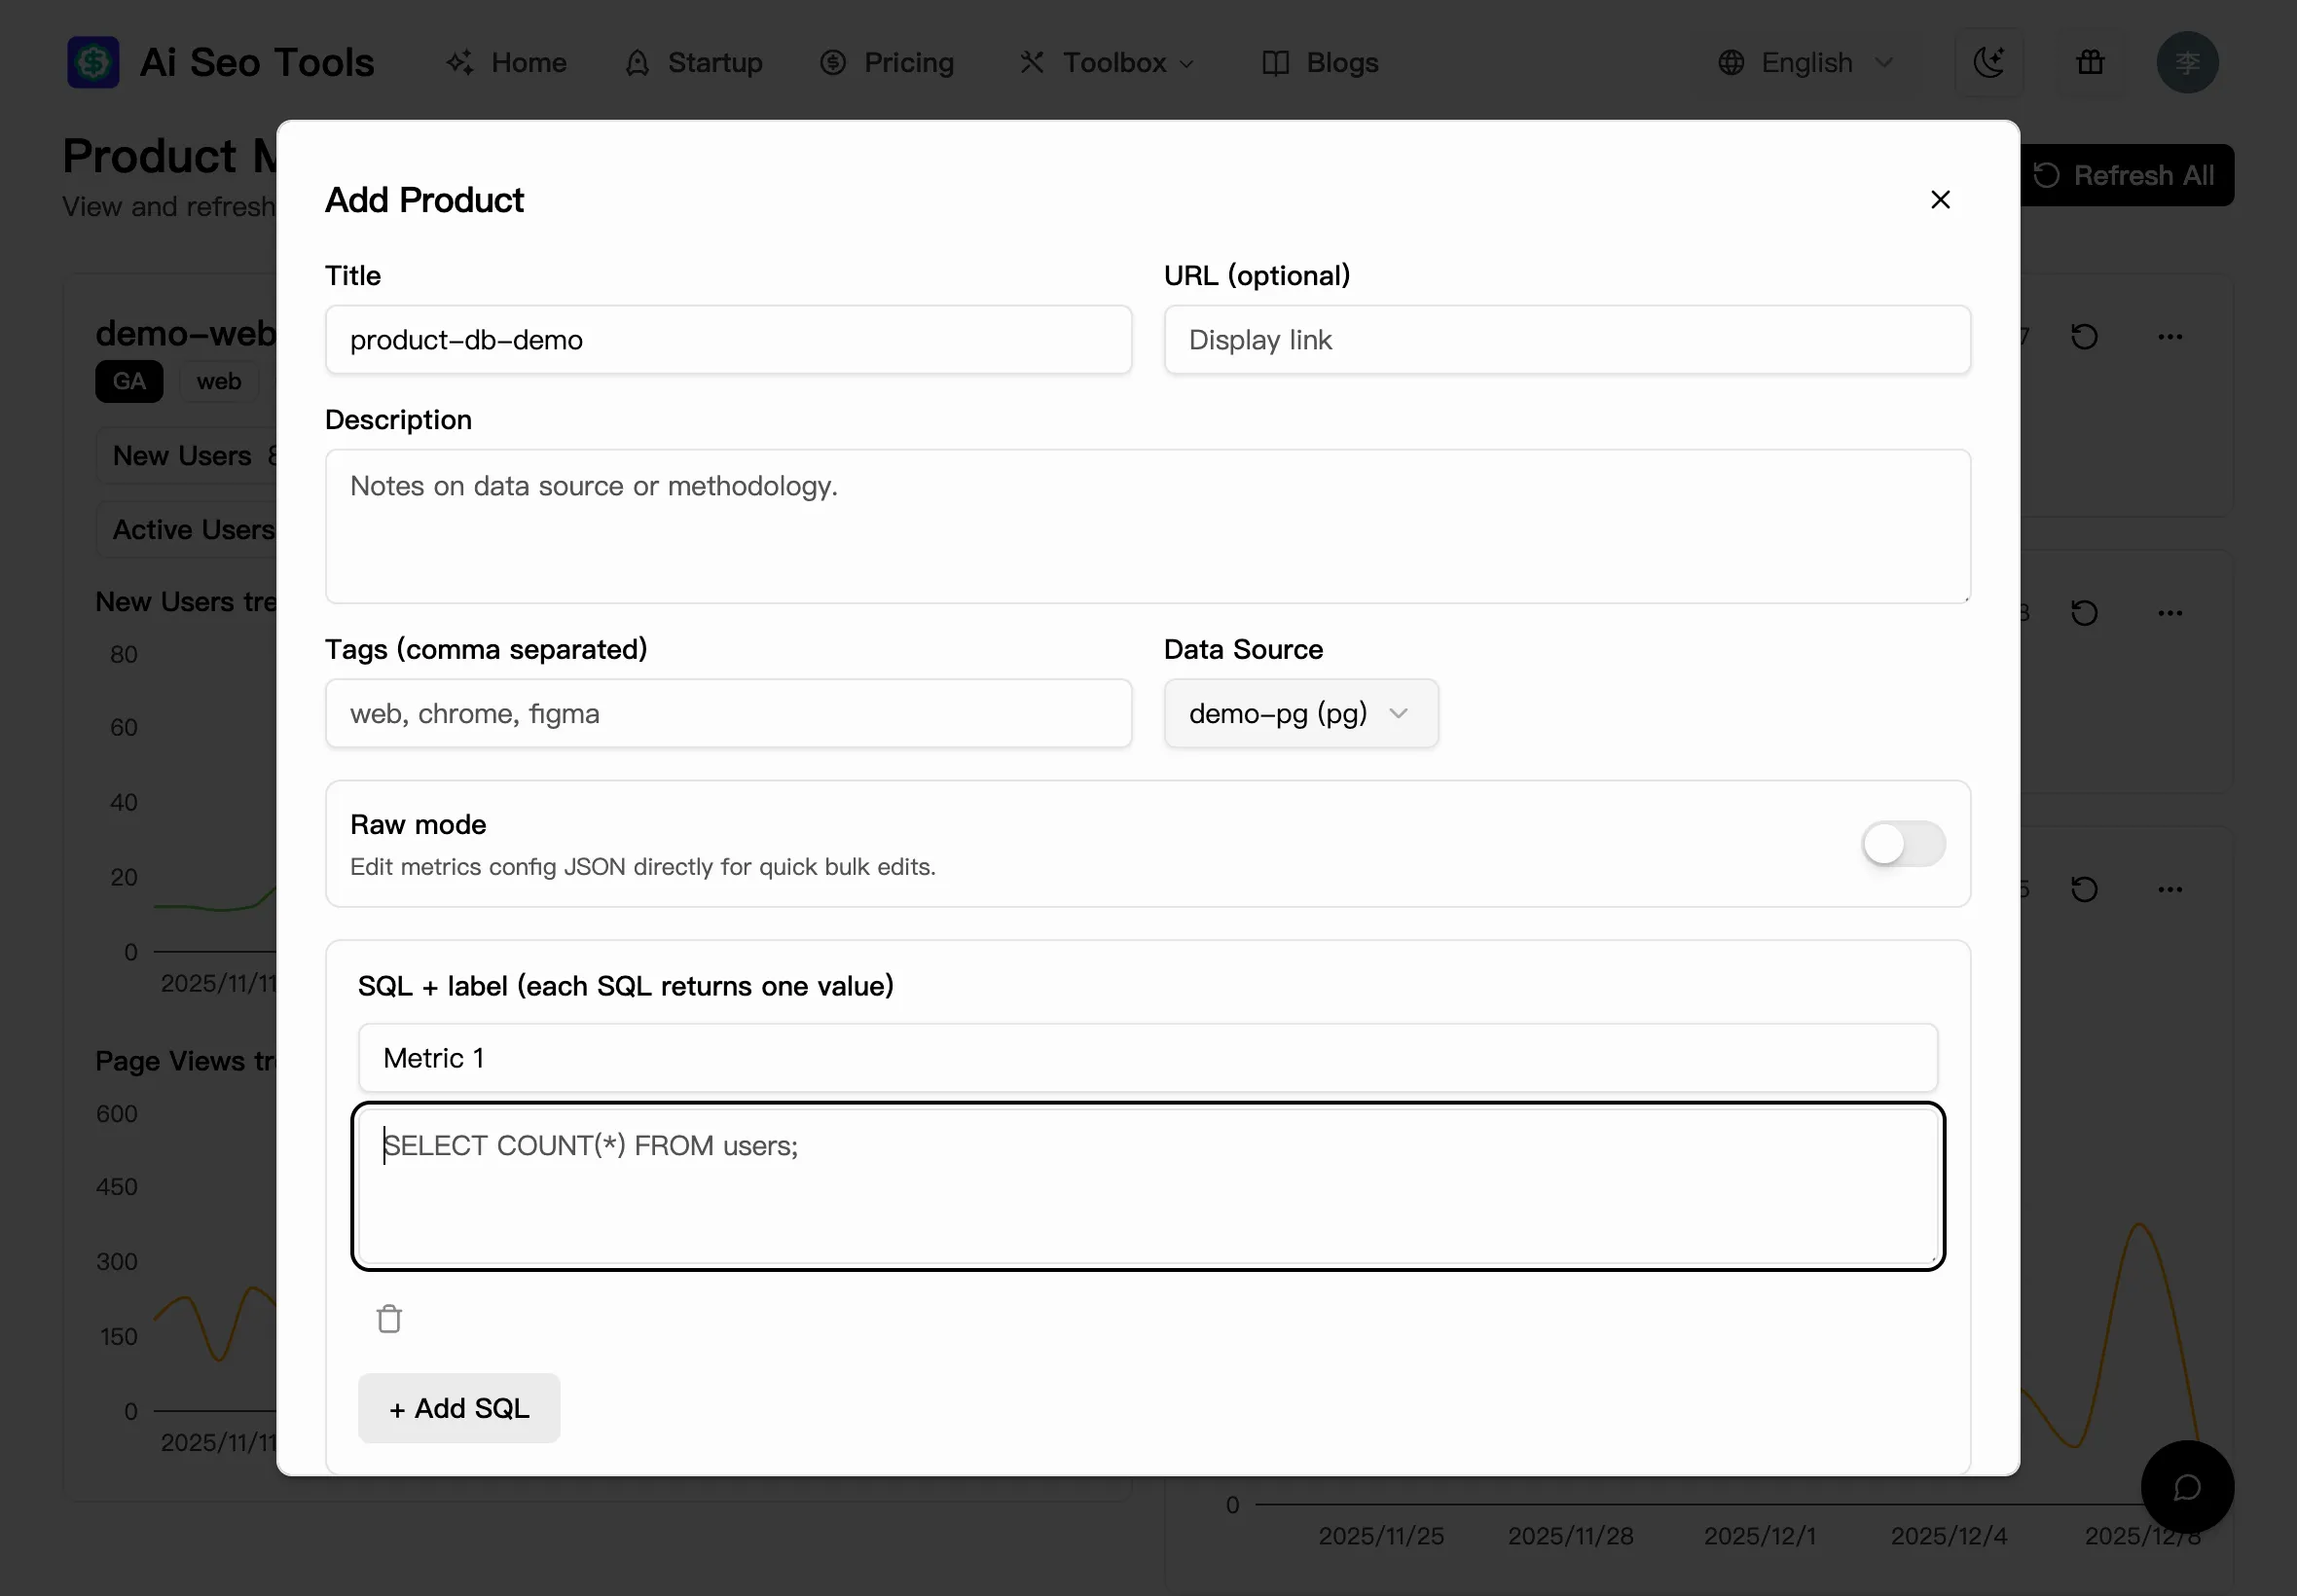
- Custom business metricsTrack signups, orders, GMV, content posts and more.
- Connected journeyLink traffic, users, conversions and retention in one flow.
- Zero heavy setupNo DIY pipelines—configure and go.
GADash fits many roles and scenarios
From site owners to marketing, product and data teams, onboarding is instant with unified sources.
Multi-site owners
Monitor every site with PV/UV/revenue in one place.
Marketers
Blend GA with signups/orders to judge ROI and traffic quality.
SaaS / content teams
Signups, retention and visits aligned on one dashboard.
Data analysts
Custom dimensions and exports without cross-system reconciliation.
E-commerce teams
Orders, GMV and traffic quality on one screen to optimize channels.
Editors
Compare topics and sections to guide content decisions.

Glance all key metrics across sites and sources
Interactive preview with site switching and dynamic trends. Log in to see the full multi-source view.
- Site switcherPick sites or product lines from a dropdown.
- Dynamic trendsLine and bar comparisons.
- Core overviewNine-grid KPIs and anomaly spotting.
Move all product data into one dashboard now
Supports GA, MySQL, PostgreSQL, JSON and HTML • No plugin • 1-minute setup